Lead UX Designer, UX Researcher
ROLE
Aug - Dec 2024
TIMELINE
Contextual Inquiry, Heat Maps, Eye Tracking
METHODS
User Interviews, Guerrilla Usability Testing
OVERVIEW
Transforming Cox Enterprises’ TechHelp Express Kiosk 🖥️
We partnered with Cox Enterprises to help transform their tech-support kiosk (TechHelp Express) over the course of the Fall 2024 semester. We aimed to increase adoption rates of the existing kiosk by expanding its functionality to include other features other than just tech support. We researched about the company’s culture and connected with a variety of employees to learn about their daily work life to find areas that could be improved by our kiosk.


PROBLEM STATEMENT
How might we design the help desk remote kiosks to be functional, intuitive, and inviting?


RESEARCH METHODS
Competitive + Comparative Analysis
Goals
Gain a deeper understanding the strengths and weaknesses of different tech support modes at Cox, as well as different kiosks at other companies
Discover how these strengths and weaknesses can differ for the users vs. the IT team
Details
Our Cox shepherds gave us a detailed explanation of available tech support methods on the Cox campus; we included common and important measures of success, such as efficiency, accessibility, etc. in our study
Weakness: Only comparing a select few things, could possibly omit other features/examples, could be affected by creator-bias

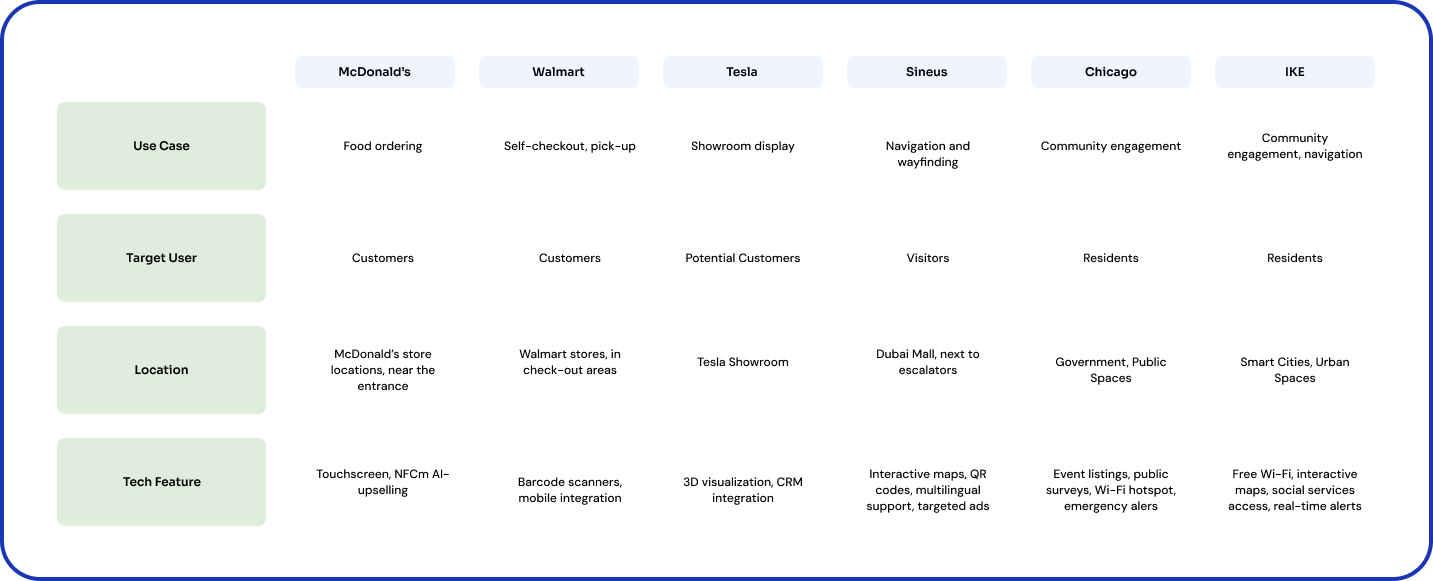
Findings
Kiosk had the highest overall score in the comparative analysis, and the Tech Bar placed close second
Kiosk scored the highest in areas such as amount of service features, efficiency based on timing, and effectivity
Many kiosks are used for check-out retail and restaurant purposes, usually with specialized capabilities
RESEARCH METHODS
Landscape Analysis
Goals
Gain a better understanding of floor layouts in the main Cox Enterprises tower
Understand employee traffic-flow on campus, locating the most walked paths to discover optimal placement of future TechExpress kiosks
Findings
We learned that the current kiosk on the 9th floor is in a decent location, but not the most optimal
Near elevators and outside conference rooms are the most optimal kiosk locations as they tend to have the highest population density

RESEARCH METHODS
Survey
Respondent Demographics
Respondents: 18 Cox Enterprises employees
Age Ranges: 55% are 35-54
Departments: IT, Communications, Marketing
Findings
Most Cox employees are satisfied with company tech support options
The majority of respondents prefer live messaging or in-person support

RESEARCH METHODS
Semi-Structured Interviews
Details
Who: 8 Cox Enterprises employees who have recently contacted tech support
My Role: I helped write the interview questions, moderated around half of our interviews, and wrote notes for each (180+) onto our Google Sheets to then be used for affinity mapping
Findings
The vast majority of interviewees are satisfied by current forms of tech support at Cox
Some employees think the tech support process could be streamlined, specifically ticketing
Most technical issues occur in the office, such as connectivity issues with office equipment


ANALYSIS
Interview Affinity Mapping
Out of 8 interviews and 179 notes, we found various patterns across our data:

1. I don’t like going out of my way to receive tech support
Analysis:
Employees often will deal with minor issues themselves, even if they can’t resolve the issue (in-office monitor, keyboard, mouse connection)
Employees are hesitant of tech-support: some are unsure if there are better options, some feel like getting support takes too long

2. I like getting my problems fixed in the best way I know how
Analysis:
Employees think some aspects of tech support could be streamlined
Most employees enjoy the live-chat and call options to receive quick, personalized support
Those who prefer to submit tickets do so for documentation and team purposes

3. I hope the kiosk can solve my various problems on campus
Analysis:
Employees face the most technical issues while working on campus
Employees use apps to order food, reserve rooms and spaces on campus
A few employees like exploring and walking around rather than staying at their desks
Many employees dislike having to walk to the Tech Bar for support when they could call stationary from their desk
DESIGN
Wireframing
Based on all of our conducted research, we came up with a table detailing our top findings -> user needs -> design implications -> value case. We then began to start sketching and wire framing our ideas.
Wireframing

Lo-Fi Feedback Sessions
To gain initial feedback on our lo-fi concepts, we held 4 expert interview sessions where we asked members of our Cox team a series of questions to gauge overall opinions and usability.


Med-Fi Feedback Sessions
After we modified our wireframes to implement some of the feedback suggestions, we again held interviews with 5 expert users on our Cox team to receive more feedback before we transitioned into high-fidelity prototyping.


EVALUATION
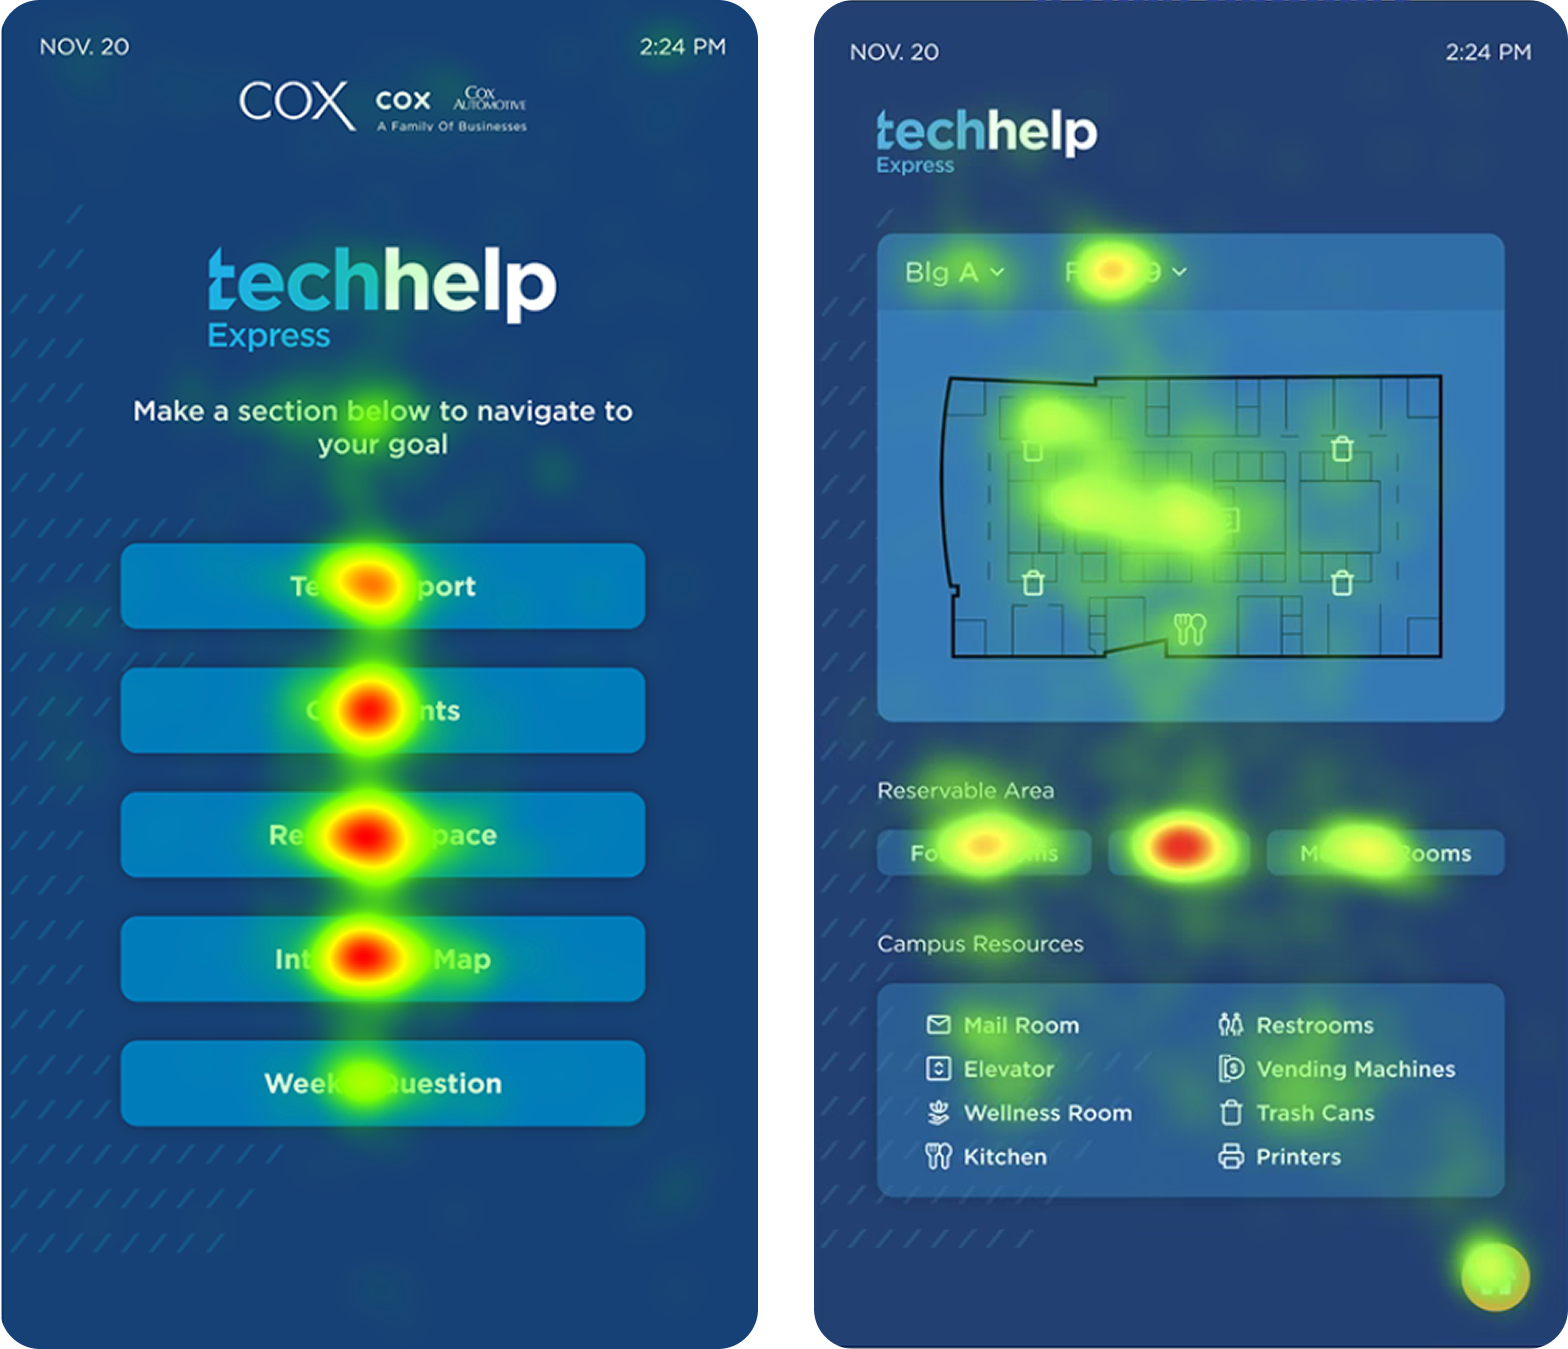
Usability Testing @ Cox Enterprises
After our wire framing feedback sessions, we moved to high-fidelity prototyping. To get one last final round of feedback, my team and I visited the Cox campus and held guerrilla user testing sessions. We set up our prototype on a vertical, touchscreen monitor in the Tech Bar, a place where employees can get in-person tech support help. We had an iPhone set up to record users with permission, as well as eye-tracking glasses to discover hot spots of our prototype.
Testing Participants
32 employees at Cox Enterprises:
18 male, 14 female
12 user-based testing
32 eye tracking and SUS forms
Testing Materials
We asked participants to complete a list of 7 tasks. Afterwards, we asked them to fill out a basic SUS form.


ANALYSIS
Eye Tracking
Cognitive Load
Outliers
We used a box-plot for the cognitive load indicator to find outliers in SUB01, SUB02, SUB25, plus SUB11, SUB30 who encountered tech problems during recording. The valid number of participants is 27.
Design Requirements
DR1. Lower the learning curve of interactive map for users
DR2. Simplify the streamline of Live Chat function
Task Duration
Task 5 takes the longest average time, at 22,493 ms, followed by Task 2 with 19,350 ms
Task 6 and Task 7 take the least time, at 8,749 ms and 6,091 ms respectively
ANALYSIS
Overall Testing Findings
Due to time constraints, we only had time to test our final prototype and make a list of needed changes, not actually implement them. Therefore, our final prototype exists as a v1 before changes from usability testing were made.


REFLECTION
Thank you, Cox team! 🎉
I thoroughly enjoyed partnering with Cox Enterprises and working with a team of fellow students in the MS-HCI program at Georgia Tech. Working directly with stakeholders led to so much growth and achievements I’m proud of!
Learnings
01: Keep a level-head under time constraints. We had so many due dates, so it was crucial for us to use our time wisely.
02: Adapt to your stakeholders’ voices and schedules. Listen to your stakeholders; be polite, yet also challenging.
03: Learn your team’s strengths. As my team had a range of backgrounds, it was important to cover each others’ weaknesses.
04. Feedback, feedback, feedback! Constant iteration added with constant feedback produces the best, most usable designs.